The Efficiency of Health Services in Spain Based on Data Envelopment Analysis (DEA). The Singularity of Health Efficiency
María Soledad Campos-Lucena, María Teresa Sanz-Díaz, Francisco Velasco Morente, Rocío Yñiguez Ovando
María Soledad Campos-Lucena1*, María Teresa Sanz-Díaz2, Francisco Velasco Morente3 and Rocío Yñiguez Ovando2
1Department of Accounting and Financial Economics, University of Seville, Spain
3Department of Applied Economics I, University of Seville, Spain
- *Corresponding Author:
- María Soledad Campos-Lucena
Department of Accounting and Financial Economics, University of Seville, Spain
Tel: +34954557616
E-mail: mscampos@us.es
Abstract
Objectives: To study the comparative efficiency of the regional health services in Spain through DEA and shed light on the orientations of health policies to improve the public perception of health services as well as the participation of citizens in formulating health Policies and setting priorities.
Study design: Comparative analysis of the efficiency of the health services of the different regions of Spain through DEA.
Methods: It uses a non-oriented approach in which efficiency is sought via an increase of the variables considered desirable, the natural unified health efficiency is employed for this aim, while the managerial unified is utilised for a decrease of the undesirable variables. The two are related through the so-called managerial natural unified health efficiency.
Results: Orientations of the health policy are indicated which each of the health systems analysed must follow in order to improve its efficiency. There are two types of possible adjustments to be carried out: natural adjustments which require the increase of the resources used, and managerial adjustments which require the decrease of the resources used. While the first only require the increase of the inputs, the second involve the modification of managerial policies which improve the results. The study enables a grouping of the health systems into four blocks in which the efficiencies can be attained through natural y/o managerial adjustments. Conclusion: The lack of efficiency can always be solved through the increase of the budget provision and only in some cases via the improvement of resource management policies.The lack of efficiency can always be solved through the increase of the budget provision and only in some cases via the improvement of resource management policies.
Keywords
Health system, Spain, Efficiency, DEA, Health care policy
Introduction
Behind the management of public resources there lies an organisational system which is based on the limited character of resources. The needs which the public sector can satisfy may be unlimited, but the resources to do so are not. This is why their use must be modulated according to criteria of the prioritisation of needs and managed in the most efficient and efficacious way.[1-6]
Since democracy was attained in Spain in 1976, the country’s economic, political and social development has been radically transformed. Within this transformation we can place prioritisation in the provision of specific services considered to be basic for the balanced advancement of a developed society. Among these services are health and education whose development is seen in the decentralised government systems designed in the Spanish Constitution in 1978, with seventeen Regional Communities (hereafter, RCs) and two Autonomous Cities.
The importance of health for the Society and the human being is demonstrated by the numerous studies about this in all areas.[7-15]
The aim of this work is to study the comparative efficiency of the regional health services in Spain through Data Envelopment Analysis (DEA) and shed light on the orientations of health policies to improve the public perception of health services as well as the participation of citizens in formulating health Policies and setting priorities. This will be in terms of the adjustments which the different health systems analysed should carry out to improve their efficiency. DEA arose as an extension of the work of Farrel et al.,16 which shows a measure of productive efficiency and its.[17,18]
Liu et al. is the first literature survey that focuses on DEA applications, covering DEA papers published in journals indexed by the Web of Science database from 1978 through August 2010.[19]
DEA has been used in various studies related to public resource management.[20-32] There are also very numerous articles which apply DEA to analyse efficiency in health use and management.[33-39] The measurement of efficiency and productivity of health service delivery has become a small industry40 and in other areas.[41-46] Our model introduces three inputs and three outputs, distinguishing between desirable outputs and undesirable outputs.[18,47]
The inputs used are: Health expenditure,[48] differentiating between health expenditure allocated per protected inhabitant to the direct attention to citizens (staff expenditure, pharmaceutical expenditure, and intermediary consumptions); health expenditure per protected inhabitant destined to agreements; and health expenditure per protected inhabitant destined to the training of resident physicians. There are two good outputs–the rate of surgical interventions [49] and the degree of satisfaction of citizens with the functioning of the public health system [50]–and one undesirable output–the mortality rate. [51]
The choice of these input variables is due to the important debate currently open about the appropriateness or not of externalising or privatising services,[52-56] as well as the need to invest in training and research.[57-62] In the case of the outputs, these are indicators of the perception of the service quality by citizens or their being recognised by the World Health Organization as indicators of the quality of the health system.[63]
The structure of this work is as follows. After this introduction, the methodology and data used are described. The results and their corresponding discussion are presented in Section 3. Lastly, the conclusions are set out.
Materials and Methods
A review of the recent literature shows the study through DEA of efficiency in the use of resources by organisations.[64,65] This traditional application of the study of efficiency focuses the analysis on an input or output orientation, according to the variables which the organisation can have an influence on. Hence, an input-oriented model is used when the variables controlled are inputs, and one that is output-oriented when the variables controlled are outputs [17,66,67] multistage procedure can be applied to do so. This generalises other procedures such as the bi-stage method68 and the three-stage method [18] and which suits Koopmans [68] efficiency.
The study of efficiency can also differentiate between those variables which are desirable or recommendable (good) and those which are undesirable or unrecommendable (bad). To sum up, it differentiates between those whose increase improves efficiency and others which act contrariwise. The improvement of efficiency is produced when their use is reduced in the case of inputs, or production in the case of outputs.[47]
Through this type of study, previous works calculate three types of models to measure efficiency. First, the so-called natural unified efficiency implies a decrease in the inputs causing a non-increase in the undesirable outputs and a non-decrease in the desirable outputs. The second is managerial unified efficiency. This relates the improvement of efficiency with additional management policies to those currently applied. The adjustments proposed obey a non-natural or managerial adjustment even increasing the inputs, not increasing the undesirable outputs and not decreasing the desirable outputs. In these two cases, it is considered that both efficiencies are independent, in such a way that the variability or influence which the organisation may have on the desirable and undesirable variables is studied. The third efficiency is natural and managerial unified efficiency which carries out a joint study of both efficiencies and provides us with a global analysis of the use of resources by organisations. To do so, it is necessary for each organisation to either increase the inputs (managerial) or diminish them (natural) independently, without, moreover, the undesirable outputs increasing or the desirable outputs decreasing. This is why two frontiers are established marked by the production functions of the efficient entities – one higher that desirable inputs and outputs should tend towards, another lower that undesirable inputs and outputs ought to tend towards.[47]
Data
In this work an analysis is carried out of the use of public health resources which the health services of the RCs and Autonomous Cities of Spain manage and its effect on the life of citizens. To do so, the Key of the National Health System,[70] published by the Ministry of Health, Social Services and Equality of the Government of Spain, has been used.
The Inputs variables used have been, in the first place, the territorialised public health expenditure per protected inhabitant allocated to the direct support of the citizens (Input 1). This includes the pharmaceutical expenditure, the remunerations of the staff and the intermediary consumptions as the main components which absorb the health investment made by the public administration in the citizens. The second input (Input 2) is the health expenditure per protected inhabitant which is allocated to agreements with private firms. The third input (Input 3) is the health expenditure per protected inhabitant which is allocated to the training of resident physicians. Indicators extracted from the same database [70] have been used as Output variables. The first output is the rate of surgical interventions per 1,000 inhabitants and year (Output 1). The second is the degree of satisfaction of the citizens with the health system (Output 2). Its increases mean an improvement in the efficiency of the use of the resources. The third output is the general mortality rate, adjusted by age, per 100,000 inhabitants (Output 3). Its decrease means, likewise, the improvement of the efficiency of the use of the resources. This is an indicator for health quality recognised by the World Health Organization. 2012 is the year of reference for all the data.
Associated with the study of efficiency we find the increasing, decreasing and constant variability of the outputs linked to the variation of the inputs. In the case of the desirable variables, or what must grow to improve efficiency, we talk of the performance rating scale or returns to scale (RTS). This magnitude shows the variation of greater, lesser or equal proportion which the desirable output variable experiences (or which must increase) when a variation of the inputs is produced. This indicates the appropriateness or not of increasing the size of the organisation. That is to say, the quantity of resources invested. For example, when RTS grows it is considered that the increase of the inputs used gives rise to a more proportional increase of the outputs.
In the case of undesirable variables or which must diminish to improve efficiency, we talk of the damages to scale rate (DTS), which reflects the variability of these inputs. In this case, the increasing, decreasing or constant effect on the outputs is similar to the RTS. However, the effect on the measures to be taken is the contrary. That is to say, when working with production factors which operate at a growing DTS, the increase of the inputs brings about a more than proportional increase in these outputs. It we take into account that they are undesirable, and that the increase of the operational size-that is to say, the volume of the investments made in the system – hinders attaining efficiency, a decrease of the inputs used is recommended. This gives rise to a more than proportional decrease of the outputs. In the case of the DTS being constant or decreasing, this decrease is not recommended, but it is accepted to maintain or increase the volume of the resources invested (inputs) or operational size, respectively.
Data envelopment analysis
DEA evaluates the operational performance of various organisational units which can belong both to the public sector and the private sector, and is considered to be a good method to carry out comparisons of efficiency. Other researches [71] sum up the previous contributions to DEA. On the one hand, the article [72] describes the story of DEA from the contributions of Professor William W. Cooper, a fundamental collaborator of this analysis technique, and [73] describe the philosophical background concerning the accounting and economics which became the basic axis of DEA.
The work of Sueyoshi et al.[74] proposes some natural and managerial adjustments to achieve efficiency. The natural adjustments imply that with a lower quality of inputs used naturally and without making any kind of change in the resource management, the undesirable outputs have to diminish naturally and it is established that the desirable outputs do not diminish. This gives rise to an increase in efficiency. Managerial efficiency consists in increasing the inputs (using better components). This has to impact on the diminishing of the undesirable outputs and it is established that the desirable outputs do not diminish.
Our two models depending of “a” exponent in first restriction in problem (1) considers «n» DMUs (in our case study, these represent the 17 RCs and two Autonomous Cities) using «m» inputs to yield «s» desirable outputs, but also to yield «h» undesirable outputs. In our problem (1) if “a” exponent is 1 the model represents Managerial efficiency, whereas if “a” exponent is 0, the model represents Natural efficient.
The «jth» DMU (j=1,…,n) uses a column vector of inputs (Xj) to yield both a column vector of desirable outputs (Gj) and also a column vector of undesirable outputs (Bj). It is assumed that Xj=(x1j,x2j,…,xmj)T>0, Gj=(g1j,g2j,…,gsj)T>0, and that Bj=(b1j,b2j, …,bhj)T>0 for each «j» (j=1,…,n), where T means transposed vectors. Structural or intensity variables are expressed with λ=(λ1,...,λn)T, which are unknown and used for connecting the input and output vectors by means of a convex combination. The optimization problem can therefore be defined by the following equation system for each DMUk (1 ≤ k ≤ n):
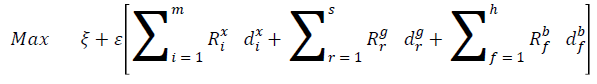
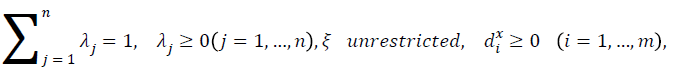

where: "ξ" , which is an unrestricted parameter, represents an unknown inefficiency score indicating a distance between an efficiency frontier and an observed vector of desirable and undesirable outputs; di x, dr g and df b are slack variables; and , ]and , where , , 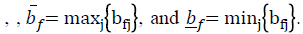 In our case, parameter "ε" takes a value of 0.0001 for the sake of computation convenience, in order to reduce the influence of slack variables.The objective function implies that two sources of inefficiency can be identified. A DMUk is efficient if and only if the following two conditions are satisfied:
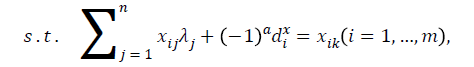
  In this efficient case, DMUk belongs to the efficient frontier. It fulfils restrictions in equation system (1), and therefore the objective function is 0. Otherwise, if it is not efficient, the value of the objective function is greater than 0. Taking into account Managerial efficiency, the first restriction in system (1) seeks values of "λ" _"j" to construct a composite unit, with inputs such that
 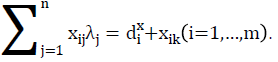 The positive slack variables di x indicate that further increases in inputs can be made, which necessarily alter the proportions used, and hence they show the existence of inefficiencies. Similarly, the second restriction,
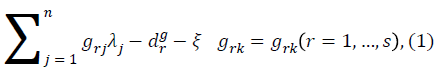
 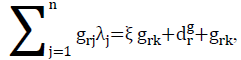 tells us that the desirable outputs can be increased or at least maintained by performing a radial expansion ξ grk and an increase in the slack variable dr g.Analogously, the third restriction,
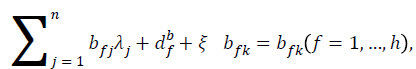
 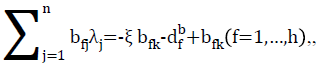 indicates the managerial aspect, since although we have increased the inputs with managerial improvements, it is possible to reduce the undesirable outputs both radially and in their slack variables.
A unified efficiency score ("θ)" under managerial output disposability is then measured by means of the following equation:
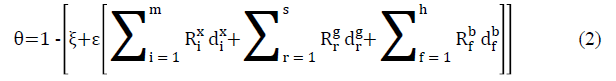
This measure of the unified efficiency score takes values between 0 and 1. If the DMUk is efficient, then the objective function of equation system (1) is 0, and hence the efficiency score equals 1.
Our health model is based on this work of Sueyoshi and Goto,74 but has substantial differences which we will now clarify.
Natural unified health model (NUHM)
The natural model proposed by Sueyoshi implies that the decreasing of the inputs (energy resources) gives rise to a natural adjustment of the undesirable outputs which means their decrease (CO2 emissions to the environment) and a non-decrease of desirable outputs. However, the NUHM model which is proposed in this work implies that the increase of the inputs brings about naturally an increase of those desirable outputs which must increase and a non-increase of the undesirable outputs which have to diminish. This means an improvement of the results obtained. This natural adjustment indicates that there is a direct natural relation with the former and the opposite with the latter, without a change in the way of managing or using the resources being produced.
This last point is what makes the bad output seem like that defined by Sueyoshi. Nevertheless, Sueyoshi et al.74 names it managerial model, as, in their case, the variation of the inputs has a direct relation with the variation of the outputs, and to reverse this relation and transform it into the opposite it is necessary to apply managerial or administration policies of the resources invested. These give rise to the increase of the inputs having a repercussion on the decrease of the bad or undesirable outputs.
Managerial unified health model (MUHM)
The managerial model proposed by Sueyoshi et al.,[74] implies that the improvement of efficiency is associated with some changes in managerial policies which enable the increase of the quantity of resources consumed (energy resources) and at the same time reduce the quantity of bad or undesirable outputs generated. In the case of the MUH model which is proposed in this work, the decrease of inputs or resources used has to bring about the desirable outputs not decreasing, due to good management, and the undesirable outputs having to decrease in order to improve efficiency.
Unlike the previous model, this adjustment does not take place naturally, as the trend that the variables follow naturally is that described in the previous model and if an increase of the inputs leads to the adjustment desired, a decrease tends to cause the opposite effect. This is why the decrease of the resources used has to be accompanied by changes in the managerial and administrative policies in such a way that the natural tendency of their variations is reversed. That is to say, the decrease of the inputs or resources allocated to the health system gives rise to non-decreases of the desirable outputs and decreases of the undesirable outputs to the levels necessary to achieve efficiency.
This model is similar to the natural model presented by Sueyoshi et al.[74] In that model the decrease of the inputs naturally causes the decrease of the bad or undesirable outputs, without it being necessary to carry out any kind of change in the managerial and administrative policies of the organisations.
The changes of managerial and administrative policies can be very diverse. They range from changes in the techniques used in the health area with the appearance of new vaccines or new drugs to the modification of the organisation of the work, the management of the inventories, etc.
Managerial natural unified health model (MNUHM)
The work of Sueyoshi et al.,[74] provides two models–one natural unified, the other managerial unified-which propose a series of independent adjustments to attain efficiency with respect to the desired and undesired variables separately. Yet it follows that the organisation works jointly with both types of variables, so it also carries out a unified study of efficiency where all the variables are taken into account.
As has become evident in the previous points, the NUH and MUH models express the joint adjustments of both the desired and the undesired variables to attain the efficiency of the health system. Therefore the MNUH study which is proposed has a different purpose than that sought by model.
In this case, the improvement of efficiency is sustained by the idea that in specific cases this efficiency cannot be improved but in others, even counting on NUH and/or MUH efficiency, the efficiency of the use of the resources utilised can be improved through new combinations of inputs (their increases and/or decreases) which enable more efficient results with increases of desirable outputs, or which must increase and/or diminish those that are undesirable or which must decrease.
We have to remark that there are technical units which are both NUH and MUH efficient, but which, however, are not MNUH efficient, implying that they have room to improve. This is due to the restrictions of the MNUH model, as the first restriction uses the two fit variables - both NUH and MUH-with which the frontier obtained in the DEA is different from those reached with the NUH and MUH models.
It can be seen in Table 1 that it is not enough for a community to have MUH and NUH efficiency to have MNUH efficiency. The reason is that when studying MUH and NUH separately we are only using one fit variable in the inputs. However, when considering the MNUH model, we are using the two fit variables employed in the MUH and NUH and we are imposing that they cannot be different from zero simultaneously. This means that when obtaining an optimum solution in the MNUH model, there are communities which have been MUH and/or NUH efficient but which, nonetheless, when considering them in their MNUH form, give us fit variables in some of the inputs in their non-null managerial or natural aspect. Yet if the health service of a community is MNUH efficient, then it is MUH and NUH efficient, as in this case the fits are null. Therefore the inefficiency is null and for the construction of the functions aimed at, both in the MUH and in the NUH, this means that the corresponding MUH and NUH inefficiencies are null, so the MUH and NUH efficiencies are unitary.
Results and Discussion
Now we will analyse the efficiency of use of public health resources made by the health systems of the 17 RGs and the two Autonomous Cities of Spain, taking as a base the previously explained variables and referring to the year 2012. Table 1 shows the data relative to NUH (NUHE), MUH efficiency (MUHE), and MNUH efficiency (MNUHE), as well as the Returns to Scale rates for the Good Outputs (RTS) and the Damage to Scale rates for the Bad Outputs (DTS). To do so we have used SCSC (Strong Complementary Slackness Condition) in order to be able to find the corresponding RTS and DTS,[75] for which it is necessary to obtain the dual problems corresponding to the MUH and NUH models.
| MUHE | NUHE | MNUHE | DTS | RTS | Nat. Ad. | Man. Ad. | Without Adjustments |
||
|---|---|---|---|---|---|---|---|---|---|
| 1 | Andalusia | 1 | 0.66 | 0.66 | Constant | Constant | x | ||
| 2 | Aragón | 1 | 1 | 0.93 | Constant | Constant | x | ↑ | |
| 3 | Asturias | 1 | 1 | 1 | Decreasing | Constant | x | ||
| 4 | Balearic Islands | 1 | 0.73 | 0.73 | Constant | Constant | x | ||
| 5 | Canary Islands | 0.74 | 0.67 | 0.62 | Constant | Constant | x | x | |
| 6 | Cantabria | 1 | 1 | 0.71 | Decreasing | Constant | ↑ | x | |
| 7 | Castille and León | 1 | 1 | 0.86 | Decreasing | Constant | ↑ | x | |
| 8 | Castille - La Mancha | 0.87 | 0.90 | 0.89 | Constant | Constant | x | x | |
| 9 | Catalonia | 1 | 1 | 0.58 | Decreasing | Increasing | ↑ | x | |
| 10 | Valencian Commun. | 0.91 | 0.74 | 0.74 | Decreasing | Constant | x | x | |
| 11 | Extremadura | 0.87 | 0.77 | 0.77 | Constant | Constant | x | x | |
| 12 | Galicia | 0.94 | 0.74 | 0.74 | Decreasing | Constant | x | x | |
| 13 | Madrid | 1 | 1 | 1 | Decreasing | Increasing | x | ||
| 14 | Murcia | 1 | 0.74 | 0.74 | Constant | Constant | x | ||
| 15 | Navarre | 1 | 1 | 1 | Decreasing | Increasing | x | ||
| 16 | Basque Country | 1 | 1 | 1 | Increasing | Increasing | x | ||
| 17 | La Rioja | 1 | 1 | 1 | Decreasing | Constant | x | ||
| 18 | Ceuta | 0.78 | 0.51 | 0.51 | Constant | Constant | x | x | |
| 19 | Melilla | 1 | 1 | 0.49 | Decreasing | Constant | x | ↑ |
Table 1: Efficiencies of the health systems of the RGs, variability rates and adjustments.
The original data are to be found in Annex 1. To carry out the efficiency study we took as a base the homogenisation of the annual data which Spain operates with on average for each of the Inputs variables. Hence the projections, in the case of the health systems’ inefficiency, are calculated according to this average. In the database shown in Table 1, it can be noted that there are RGs which require a series of adjustments to attain efficiency and others that do not. There are two types of possible adjustments to be carried out. On the one hand, natural adjustments which require the increase of the resources used (a greater budget provision) and which lead to the improvement of the results obtained through the bettering of the desirable outputs and the non-worsening of the undesirable outputs. This amelioration of the NUH efficiency does not require active policies of management resources. That is to say, it is enough to increase the resources allocated to health for the results to improve.
On the other hand, managerial adjustments which require the decrease of the resources used (a lower budget provision) and which lead to the improvement of the results obtained through the bettering of the undesirable outputs and the non-worsening of the desirable outputs. While the first only require the increase of the inputs, the second involve the modification of managerial policies which improve the results.
It can be observed in Table 1 that in the case of requiring adjustments, these can be natural and/or managerial. This depends on the efficiency which one intends to achieve with the adjustments. To attain NUHE in the health service a natural adjustment must be carried out. To achieve MUHE a managerial adjustment has to be done. To reach MNUHE, the adjustments can be both natural and managerial, depending on the input variable to be adjusted.
In this last case, in Table 1 we have marked with an upwards arrow the type of adjustment which prevails over the other. This is because if the natural adjustments prevail over the managerial adjustments, the increase in the budget provision of some lines surpasses the decrease of budget provision of others, and this causes adjustments in the outputs which place the entity among the efficient organisations from the MNUHE point of view.
In contrast, if managerial adjustments prevail over natural adjustments, this means a saving of public resources in net terms, so precedence must be given to the improvement of resource management policies over natural adjustment, which produces a greater provision of these resources. These adjustments provide a saving in net terms of the resources allocated to the health system by the RG. It must be taken into account that we are talking about public resources and if the saving of resources is important for any organisation from the economic viewpoint, when it is a question of public resources it is even more so. There is a need to prioritise when administrations decide which services to provide. In the case of public resources which can be used to provide citizens with a practically unlimited quantity of services, reducing the resources invested in one service implies the possibility of giving another. This is linked to the improvement of the profitability of the investment, which illustrates the relation between the resources invested and the performance obtained.
Lastly, there is no regional health service which counts on NUH efficiency but not on MUH. This can be seen in the fact that the lack of efficiency can always be solved by a greater financing by the RGs and only at times with the improvement of resource management policies.
In Annexes II, III and IV, we can note in detail the adjustments necessary to carry out in the different Spanish health systems to attain each of the efficiencies. In the case of the health services of the RGs of Asturias, Madrid, Navarre, the Basque Country and La Rioja, these are efficient from both the natural and managerial point of view independently, as well as when the unified efficiency is analysed. Thus there is an efficient use of the resources employed and no kind of adjustment needs to be made.
The production functions of these health systems are those which establish the efficient frontier towards which the rest of the health systems must tend. This is the case both when they look for efficiency through the natural adjustment caused by the increase in the resources allocated to public health and when they seek efficiency with the reduction of these resources via an improvement of their management. In the same way, they are among the best when the study is done involving all the variables of the MNUH form.
The rest of the health systems which operate in Spain need to carry out some kind of adjustment to be efficient units.
The health services of Aragón, Cantabria, Castille-León, Catalonia and that of the Autonomous City of Melilla have NUH and MUH efficiency but do not have MNUH. To attain efficiency in the health services of Aragón and Melilla managerial adjustments prevail. In those of Cantábria, Castille-León and Catalonia natural adjustments predominate.
The health services of the RGs of Andalusia, the Balearic Islands and Murcia only have MUHE. In these cases, to attain efficiency they must be endowed with more budget, as their efficiency would be naturally increased from both the viewpoint of NUHE and MNUHE. Nevertheless, in the case of Murcia, it would be necessary to minimally reduce the resources allocated to agreements with private firms, but even so the budget provision must increase.
It can be noted how the adjustments recommended to attain the two efficiencies (NUH and MNUH) are similar for both the health service of Andalusia and that of the Balearic Islands. This is due to two fundamental facts. The first relates to the point projected onto the efficiency frontier being marked by two vectors that establish an interval. The level of use of inputs and the level of production of outputs of the inefficient health service are located within this interval, and attaining efficiency means tending towards it. The second is that the coefficients applied to the MUH, NUH and MNUH efficiencies have a minimum distance. This is enough to show the difference between efficiencies and the negative weight which the lack of efficiency has on the MNUH. But it is not enough to modify the interval established by the vectors which mark the point on the efficient frontier. This implies that when analysing the MNUH in the management of resources to obtain some specific levels of outputs, the organisation must be capable of improving the efficiency to place itself on the higher and lower efficient frontiers marked by the production functions of the most efficient organisations in their resource management.
In all these cases the returns to scale (RTS) is constant (Table 1). This implies that an increase of the inputs brings about an increase in the same proportion of the desirable outputs. That is to say, the increase of the volume of investments managed by the health service gives rise to an increase of the same proportion in the variables which must increase without the need to modify the way of working or managing the health service’s resources.
The last group is made up of the health services of the RGs of the Canary Islands, Castille-La Mancha, the Valencian Community, Extremadura, Galicia and the Autonomous City of Ceuta. These health services do not attain any of the three efficiencies studied. This means the possibility of reaching them through either natural or managerial adjustments.
Conclusion
The study of the efficiency of organisations through DEA is widespread. The particularity of the DEA system applied to the health system implies that the results obtained are different from those which would be obtained in other sectors.
The study that we have carried out of the health systems of the seventeen RGs and the two autonomous cities enables a grouping into four blocks:
a) The first is made up of five health systems which have NUH efficiency, MUH efficiency and MNUH efficiency. This group is made up of the health services of Asturias, Madrid, Navarre, the Basque Country and La Rioja.
b) The second is formed by five health systems that have NUH and MUH but do not have MNUH. This implies the possibility of improving efficiency when the study is carried out globally and is compared with the health services of the first group. This improvement leads to grouping these health services into two:
b.1) The health services of Aragón and Melilla can improve in terms of MNUH efficiency by applying natural and managerial adjustments, and a variation of the budget provision of the different lines in a way which means a saving of public resources in net terms.
b.2) The health services of Cantabria, Castille-León and Catalonia can improve in terms of MNUH in the same way with the variation of the budget provision of the different lines, but in this case natural adjustments prevail which motivate the provision of a greater quantity of resources over those which require changes in managerial policies.
c) The third block is made up of the health services of the RGs of Andalusia, the Balearic Islands and Murcia. In these cases the health services have MUH efficiency but do not have either NUH or MNUH efficiency. The improvement of the efficiency of these health services is achieved through the increase of resources made available to them, which gives rise to a natural adjustment that improves the results achieved.
d) The fourth block is formed of the health services of the RGs of the Canary Islands, Castille-La Mancha, the Valencian Community, Extremadura, Galicia and the Autonomous City of Ceuta. These health systems do not attain any of the three efficiencies studied. This means that the different efficiencies can be attained through natural or managerial adjustments, or a combination of both.
It is demonstrated that the lack of efficiency can always be solved through the increase of the budget provision and only in some cases via the improvement of resource management policies. Examples of these are policies of incentives or objectives of the staff, or those which are orientated towards savings. These may be a more rational management of drugs, better inventory systems (just in time, for example) or medicine auctions, improvements in energy consumption using devices which enable saving energy, installations of renewable energies, the efficient use of water, technological improvements, and programmes of preventative medicine which decrease the rate of mortality while increasing the early detection of illnesses, meaning a less costly treatment in terms of time and resources.
The rational use of the limited resources which the public administrations have to provide a quantity of services that can be unlimited underlies the three types of efficiency studied in this work. This leads us to consider that this model can be appropriate for measuring the efficiency of other services provided by the public sector, such as education, social services or environmental investments.
Acknowledgment
Authors are grateful for the financial received from the projects SEJ132, SEJ 442 y SEJ472 from the University of Seville. All authors take full responsibility for the content of the paper.
References
- Goh SC. Making performance measurement systems more effective in public sector organizations. Measur Busines Excel 2012; 16: 31-42.
- Speklé RF., Verbeeten FH. The use of performance measurement systems in the public sector: Effects on performance. Manag Accoun Res 2014; 25: 131-146.
- Rosen B., Waitzberg R., Merkur S. Israel: Health System Review. Healt Sys Trans 2015; 17: 1-212.
- Brinkerhoff DW., Brinkerhoff JM. Public sector management reform in developing countries: Perspectives beyond NPM orthodoxy. Public Administ Develop 2015; 35: 222-237.
- Gerrish, E. The Impact of Performance Management on Performance in Public Organizations: A MetaÃÆâÃâââ¬ÃâÃÂAnalysis. Public Administ Rev 2016; 76: 48-66.
- Rosenberg HJ., Ferlie E. Applying strategic management theories in public sector organizations: Developing a Typology. Public Manag Rev 2016; 18: 1-19.
- Wakaskar RR. Brief Overview of Nanoparticulate Therapy in Cancer. J Drug Targ 2017; 5: 1-16.
- Wakaskar RR. General Overview of Lipid-Polymer Hybrid Nanoparticles, Dendrimers, Micelles, Liposomes, Spongosomes and Cubosomes. J Drug Targ 2017; 5: 1-8.
- Wakaskar RR. Challenges Pertaining to Adverse Effects of Drugs. Inter J Drug Dev Res 2017; 9: 01-02.
- Ambardekar VV., Wakaskar RR., Sharma B., Bowman J., Vayaboury W., et al. The efficacy of nuclease-resistant Chol-siRNA in primary breast tumors following complexation with PLL-PEG (5K). Biomaterials 2013; 34: 4839-4848.
- Wakaskar RR. Polymeric Micelles and their Properties. J Nanomed Nanotechnol 2017; 8: 1000433.
- Wakaskar RR. Cancer Therapy with Drug Delivery Systems. J Pharmacogenom Pharmacoproteom 2017; 8: 100e1578.
- Wakaskar RR. Types of Nanocarriers–Formulation Methods and Applications. J Bioequival Bioavailab 2017; 9: 10000e77.
- Wakaskar RR. Promise Effects of Nanomedicine in Cancer Drug Delivery. J Drug Targ 2017; 5: 1-6.
- Wakaskar RR. Cancer Therapy with the Aid of Nanotherapeutics. J Biomol Res Therap 2017; 6: 1000e155.
- Farrell MJ. The measurement of productive efficiency. J Royal Stat Soc 1957; 120: 253-290.
- Coelli T. A guide to DEAP 2.1. A data envelopment analysis (computer) program, en CEPA Working Paper 96/8, Department of Econometrics, University of New England, Armidale, Available at: https://www.owlnet.rice.edu/~econ380/DEAP.PDF.
- Cooper RW., Seiford LM., Karou T. Data envelopment analysis. A comprehensive text with Models, Applications, References and DEA-solver software. Springer: New York 2007.
- Lu., Lu WM., Lin BJ. A survey of DEA applications. Omega 2013; 41: 893-902.
- Lowell CAK., Muñiz M. Eficiencia y productividad en el sector público: temas dominantes en la literature. Papeles Economía Española 2003; 95: 47-65.
- Smith PC., Street A. Measuring the efficiency of public services: the limits of analysis. J Royal Stat Soc 2005; 168: 401-417.
- Jie PXB. Fiscal Decentralization and Local Public Good Provision in China. J Fin Trade Econom 2006; 2: 009.
- Sampaio BR., Neto OL., Sampaio Y. Efficiency analysis of public transport systems: Lessons for institutional planning. Transport Res Policy Prac 2008; 42: 445-454.
- Zhu YC., Tang JL., Liu CM. Evaluation on rural public service efficiency based on DEA in China J Soft Sci 2010; 3: 37-43.
- Guccio C., Pignataro G., Rizzo I. Measuring the efficient management of public works contracts: A non-parametric approach. J Public Proc 2012; 12: 528.
- Fox KJ. Efficiency in the public sector. Springer Science Business Media 2013; 1: pp:12.
- Nazarko J., Saparauskas J. Application of DEA method in efficiency evaluation of public higher education institutions. Technol Econom Develop Econom 2014; 20: 25-44.
- Azadi M., Shabani A., Khodakarami M., Saen RF. Planning in feasible region by two-stage target-setting DEA methods: An application in green supply chain management of public transportation service providers. Transport Res Logis Transport Rev 2014; 70: 324-338.
- TomaÃÆââ¬Â¦ÃâþeviÃÆââ¬Å¾ÃâàN., Seljak J., Aristovnik A. TQM in public administration organisations: an application of data envelopment analysis in the police service. Total Qual Manag Busin Excel 2015; 1: 1-17.
- Herrero TL., Martín MJJ., del Amo GL., del Puerto M. Technical efficiency of traditional hospitals and public enterprises in Andalusia (Spain). Gaceta Sanitaria 2015; 29: 274-281.
- Orive SV., Latorre MP., Artero MJP. Measuring the technical efficiency of public service broadcasters: An application of DEA in Spain. Revista Métodos Cuantitativos Economía Empresa 2016; 25: 21.
- Drautz AV. A study of the efficiency of food safety programs of local Public Health Departments in the state of Michigan. Central Michigan Univer Libra 2016; 5: 122.
- Rouse P., Swales R. Pricing public health care services using DEA: Methodology versus politics. Ann Opera Res 2006; 145: 265-280.
- Barbetta GP., Turati G., Zago AM. Behavioral differences between public and private notÃÆâÃâââ¬ÃâÃÂforÃÆâÃâââ¬ÃâÃÂprofit hospitals in the Italian National Health Service. Healt Econom 2007; 16: 75-96.
- Irfan SM., Ijaz A. Comparison of service quality between private and public hospitals: Empirical evidences from Pakistan. J Qual Technol Managt 2011; 7: 1-22.
- Sheikhzadeh Y., Roudsari AV., Vahidi RG., Emrouznejad A., Dastgiri S. Public and private hospital services reform using data envelopment analysis to measure technical, scale, allocative, and cost efficiencies. Healt Promot Perspect 2012; 2: 28-41.
- Alonso JM., Clifton J., Díaz-Fuentes D. The impact of New Public Management on efficiency: An analysis of Madrid's hospitals. Healt Policy 2015; 119: 333-340.
- Castelli A., Street A., Verzulli R., Ward P. Examining variations in hospital productivity in the English NHS. Euro J Healt Econom 2015; 16: 243-254.
- Yang CC. Measuring health indicators and allocating health resources: a DEA-based approach. Healt Care Manag Sci 2016; 5: 1-14.
- Hollingsworth B. The measurement of efficiency and productivity of health care delivery. Healt Econom 2008; 17: 1107-1128.
- Moreno JJ., Velasco MF., SanzDiaz, MT. Assessment of the operational and environmental efficiency of agriculture in Latin America and the Caribbean. Agri Econom 2016; 25: 126.
- Moreno MJJ., SanzDiaz MT., Velasco MF., Ludena CE. A DEA-Based Evaluation of Latin America and the Caribbean Agricultural Environmental Performance Under the Assumption of Natural and Managerial Efficiency. Revista Economía Mundial 2017; 47: 157-178.
- Exposito GA., Velasco MF. Municipal solid-waste recycling market and the European 2020 Horizon Strategy: A regional efficiency analysis in Spain. J Clean Product 2018; 172: 938-948.
- Exposito GA., Fernandez SJ., Velasco MF. Crecimiento económico, pobreza y desigualdad: un análisis de eficiencia para América Latina en el siglo XXI. Revista Economía Mundial 2017; 47: 117-138.
- Fernandez SJ., Berbegal ZV., Velasco MF., Exposito GA. Efficient entrepreneurial culture: a cross-country analysis for developed countries. Intern Entrep Manage J 2018; 17: 440.
- SanzDiaz MT., Velasco MF., Yñiguez OR., Díaz CE. An analysis of Spain's global and environmental efficiency from a European Union perspective. Energy Policy 2017; 104: 183-193.
- Sueyoshi T., Goto M. Returns to scale and damages to scale on U.S. fossil fuel power plants: radial and non-radial approaches for DEA environment assessment. Energy Econom 2012; 34: 2240-2259.
- Hadad S., Hadad Y., Simon-Tuval T. Determinants of healthcare system’s efficiency in OECD countries. Euro J Health Econom 2013; 14: 253-265.
- Donghua L., Lan Q., Ying B. The M & A Performance of the Listing Medical Companies in China—Based on DEA Analysis. Reform Strategy 2008; 10: 054.
- Adang EM., Borm GF. Is there an association between economic performance and public satisfaction in health care? Euro J Healt Econom 2007; 8: 279-285.
- Clement JP., Valdmanis VG., Bazzoli GJ., Zhao M., Chukmaitov A. Is more better? An analysis of hospital outcomes and efficiency with a DEA model of output congestion. Health Care Manage Sci 2008; 11: 67-77.
- Moschuris SJ, Kondylis MN. Outsourcing in public hospitals: a Greek perspective. J Health Organ Manag 2006; 20: 4-14.
- Hodge GA, Greve C. Public–private partnerships: an international performance review. Public Administr Rev 2007; 67: 545-558.
- Girth AM., Hefetz A., Johnston JM., Warner ME. Outsourcing public service delivery: Management responses in noncompetitive markets. Public Administr Rev 2012; 72: 887-900.
- Alonso JM., Clifton J., Díaz-Fuentes D. Did new public management matter? An empirical analysis of the outsourcing and decentralization effects on public sector size. Public Manag Rev 2015; 17: 643-660.
- Choi TM., Wallace SW., Wang Y. Risk management and coordination in service supply chains: information, logistics and outsourcing. J Operat Res Society 2016; 67: 159-164.
- Hartley J. Innovation in governance and public services: Past and present. Public Money Manage 2005; 25: 27-34.
- Glasgow RE., Vinson C., Chambers D., Khoury MJ., Kaplan RM., et al. National Institutes of Health approaches to dissemination and implementation science: current and future directions. Am J Public Health 2012; 102: 1274-1281.
- McKee M., Stuckler D., Basu S. Where there is no health research: what can be done to fill the global gaps in health research? PLoS Med 2012; 9: e1001209.
- Begley CG., Ioannidis JP. Reproducibility in science improving the standard for basic and preclinical research. Circulation Res 2015; 116: 116-126.
- El-Noush H., Silver KL., Pamba AO., Singer PA. Innovating for women’s, children’s, and adolescents’ health. PLoS Med 2015; 11: 132.
- Thune T., Mina A. Hospitals as innovators in the health-care system: A literature review and research agenda. Res Policy 2016; 4: 45.
- Wiley MT., Rivas RL., Hristidis V. Provider attributes correlation analysis to their referral frequency and awards. BMC Health Serv Res 2016; 16: 1.
- Campos LMS., Velasco MF. The efficiency of Public Television in Spain: Application of the DEA Measurement Model. Revista Ciencias Sociales 2013; 19: 363-378.
- González RMR., Velasco MF, González AL. La eficiencia del sistema de protección social español en la reducción de la pobreza. Papeles Población 2010; 16: 123-154.
- Campos MS., Fernández-Montes A., Gavilan RJM., Velasco MF. Public resource usage in health systems: a data envelopment analysis of the efficiency of health systems of autonomous communities in Spain. Public Health 2016; 138: 33-40.
- Coelli T. A multi-stage methodology for the solution of orientated DEA models. Operat Res Let 1998; 23: 143-149.
- Alí AI., Seiford LM. The mathematical programming approach to efficiency analysis. Fried HO, Lovell CAK, Schmidt (eds.), in The measurement of productive efficiency, Oxford University Press, New York 1993; pp 23.
- Koopmans TC. Efficient allocation of resources, Econometrica 1951; 19: 455-465.
- INCLASNS : Base de datos de Indicadores Clave del Servicio Nacional de Salud del 2014. https://www.msssi.gob.es/estadEstudios/estadisticas/sisInfSanSNS/inclasSNS_DB.htm. Accessed 15 June 2015
- Emrouznejad A., Parker BR., Tavares SG. Evaluation of research inefficiency and productivity: A survey and analysis of the first 30 years of scholarly literature in DEA. Socio Economic J 2010; 5: 2.
- Glover F., Sueyoshi T. Contributions of Professor William W. Cooper in operations research and management science. Euro J Operat Res 2009; 197: 1-16.
- Ijiri Y., Sueyoshi T. Accounting essays by Professor William W. Cooper: Revisiting in commemoration of his 95th birthday. J Account Finan Busin Stu 2010; 42: 464–505.
- Sueyoshi T., Goto MA. Comparative study among fossil fuel power plants in PJM and California ISO by DEA environmental assessment. Energy Econom 2013; 40: 130-145.
- Sueyoshi T., Goto M. Returns to scale and damages to scale on U.S. fossil fuel power plants: radial and non-radial approaches for DEA environment assessment. Energy Economics 2012; 34: 2240-2259.

Open Access Journals
- Aquaculture & Veterinary Science
- Chemistry & Chemical Sciences
- Clinical Sciences
- Engineering
- General Science
- Genetics & Molecular Biology
- Health Care & Nursing
- Immunology & Microbiology
- Materials Science
- Mathematics & Physics
- Medical Sciences
- Neurology & Psychiatry
- Oncology & Cancer Science
- Pharmaceutical Sciences