Bayesian Analysis Links Weather, Cerebral Infarction and Gene Expression
Hiroshi Morimoto
Hiroshi Morimoto*
Nagoya University, Nagoya 464, Japan
- *Corresponding Author:
- Hiroshi Morimoto
Nagoya University, Nagoya 464, Japan
Tel: 81527894221
E-mail: hiroshim@info.human.nagoya-u.ac.jp
Abstract
Climate is one of the environmental factors which affect human health. Health risks associated with exposure to cold are well documented using methods of regression models. Besides, for cerebral infarction, regression models provided warning systems which were operated in several countries, using a threshold of temperature: If temperature decreases below (or increases over) the threshold, they provide a warning message (or safe message) on cerebral infarction in winter. However, if there are non-negligible high-risk cases with high temperature in winter, then this warning system therefore becomes highly dangerous. Exploring the features of weather patterns including warm cases becomes important in addition to the cases of cold exposure. In this study, we attempted to analyse the pattern of weather changes that affected the onset of cerebral infarction, paying attention to the cases of high risk and high temperature, and tried to suggest a mechanism of the onset of disease by exploring the data of expressions of DNA during particular changes of weather. We use Bayesian analysis as a method to explore the features of these high-risk cases. We identified a "cool and warming pattern" among high-risk cases for the incidence of cerebral infarction. This suggests a mechanism different from cold exposure, reaching the onset of cerebral infarction. At a DNA level, there is known a similar feature in the gene expression data for inflammatory DNA. We conclude that there is a common feature, cool and rewarming, between the change of weather and gene expressions. This finding will contribute to clarify a mechanism for the incidence of cerebral infarction.
Keywords
Bayesian, Cerebral infarction, Stroke, Weather, Cool, Warming
Introduction
Cold exposure was believed as a main trigger of diseases such as cerebral infarction and myocardial infarction.[1,2] An increase in several significant risk factors for stroke can be attributed to cold exposure. In addition, the report [3] found that rapid weather changes are associated with increased ischemic stroke risk by a case-crossover study. These studies have used standard statistical techniques such as regression models.
Based on these regression models, several warning systems were invented, using a threshold of daily temperature. For example, the city of Hiroshima is maintaining a warning system that provides information of safe day or dangerous day for cerebral infarction and myocardial infarction. They post a warning on cerebral infarction if the temperature decreases below 9 degree Celsius during winter. They also give a declaration of safety if his temperature exceeds 9 degree Celsius.
However, such warning system gets into danger if there are non-negligible events of high risk and high temperature cases. In fact, the maximum number of hospitalized patients of cerebral infarction in Nagoya occurred when the mean temperature was highest among the month in Nagoya City.
Further, there was found a particular pattern in temperature and air pressure for cerebral infarction even on warm days in winter seasons, using association analysis. [4] This means that the warning system that uses a threshold of temperature collapses and even becomes dangerous.
Therefore, in this paper, we attempt to explore these exceptional cases (high risk and high temperature) by Bayesian statistics in detail. By investing relation between weather patterns and risk of disease, we found a "cool and rewarming pattern" as a common feature in these exceptional cases.
This finding led us to explore the mechanism of the onset of cerebral infarction at a molecular level. A similar cool and rewarming pattern was recognized in the field of gene expressions. For example, it is known that the expression of Interleukin-8 (IL-8) increased after cool and rewarming. [5,6] The IL-8 is known to be expressed in BEC and cause inflammation. They examined the effect of cold stimulation on IL-8 expression in human bronchial epithelial cells. They found that cool and rewarming-stimulation induced IL-8 mRNA expression.
This suggests that the cool and rewarming aspect is related to inflammation in human body. Therefore it becomes important to argue that the inflammation may be related to weather changes, onset of cerebral infarction and gene expressions. We discuss this relationship in connection with cool and rewarming pattern found by Bayesian analysis in discussion section in greater detail.
Method
This study was based on four types of data: the daily numbers of hospitalized patients of cerebral infarction, meteorological information (such as mean temperature), weather patterns (such as cold pattern of low atmospheric pressure) and gene expression profiles.
The data of patients of cerebral infarction was the daily data of the number of patients during two periods, from 2002 to 2005 and from 2009 to 2012, which were obtained from the city of Nagoya. Nagoya is Japan's third-largest city and is located on the Pacific coast on central land of Japan. As of 2015, 2.28 million people lived in the city. Nagoya has a humid subtropical climate with the four characteristic annual seasons. Rain falls throughout the year. The data included the number of patients of all ages, who were first transported by ambulance to a hospital and then diagnosed at the hospital with cerebral infarction.
The meteorological data comprised a selection of daily data, obtained from the Japan Meteorological Agency. These data included temperature (mean, maximum and minimum temperatures) and the hours of sunshine and so on.
We also used previously classified daily data on weather patterns. [7] The classification of these patterns of weather was established, using self-organized mappings (SOM). The following six groups of weather patterns were identified: "a warm type of high air pressure air (W1)", "a cold type of high air pressure air (W2)", "a cold type of low air pressure air (W3)",” a type of rain (W4)", "a warm type of low air pressure (W5)" and "a humid type of low air pressure (W6)".
We will make use of the conditional rule of probability based on the principle of Bayesian inference.
Bayesian analysis uses the rules of probability of unobserved quantities.
Understanding those distributions enables the researchers to make statements about
Processes tempered by specification of uncertainty.
It is fundamental to Bayesian analysis to understand the distributions among things that are known versus unknown, random variables versus fixed quantities.
We now introduce the concept of conditional rule which is critical for Bayesian approach (See the report [8] for the elements of Bayesian analysis).
Let A be a condition about temperature and B a condition about risk of disease. Then it is natural to consider a probability that B occurs given our knowledge of the occurrence of A.
This probability is called a conditional probability and denoted by P (B | A).
This looks natural because we are talking about the probability of the result, supposing a condition of cause:
{temperature} => {risk}, A => B.
The essence of Bayesian approach is to consider a probability reversed, P (A | B).
We suppose the condition of result and infer the probability of cause.
The probability that A occurs given the occurrence of B is denoted by P (A | B).
These probabilities are connected by the following Bayes' Theorem.

sampel
By this argument, we can ask the value of P( temperature= x | risk=high).
Regarding x as a random variable, the following value gives a distribution of x,
P (* | risk=high),
When the risk is supposed to be "high". This distribution was explored in the result section.
Results
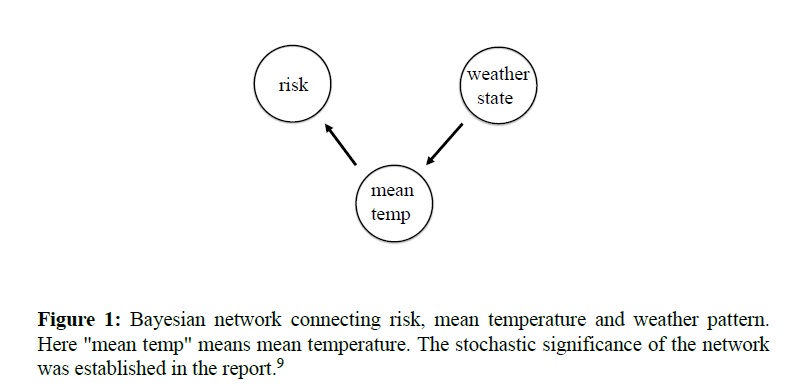
A Bayesian network was constructed, connecting three nodes: the node of mean temperature, the node of weather patterns and the node of risk of cerebral infarction. [9] The network was guaranteed by a learning approach for addressing the problem of optimization based on the counts of Bayesian score.
In general, Bayesian statistics are assembled by the sets of conditional probability P (A | B) that represent the probability of the condition A when the condition B is satisfied. Since the arrow was drawn from the node of mean temperature to the node of risk of disease, it is natural to explore the conditional probabilities P (A | B), where A is a mean temperature and B is some condition on the risk. Because the analysis of high-risk cases is important for human health, the condition B is something like "the risk is very high". To define clearly this condition, we divided the daily data of the patients into three cases: "high risk", "middle risk" and "low risk" so that the 25% of all the cases belonged to high risk, 50% to middle risk and 25% to low risk, based on the distribution of the number of patients for winter seasons.
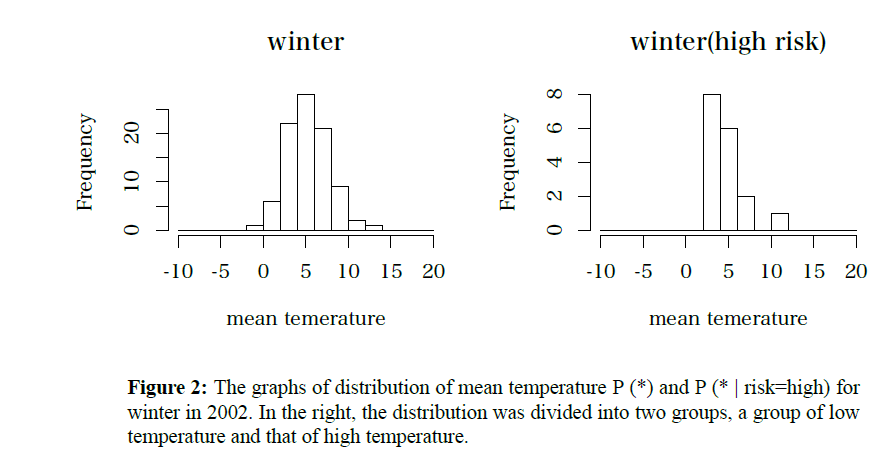
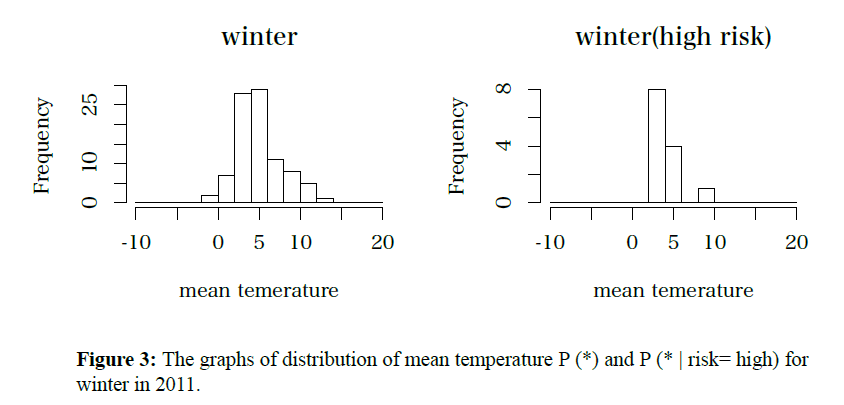
Therefore, the exploring the conditional probability P (A | high risk) became interesting. Gathering all these probability, we could obtain the "distribution" of mean temperature that caused high risk: P (* | high risk). Thus we calculated all the distribution function of P (* | high risk) for all winter seasons during the period from 2002 to 2004 and the period from 2009 to 2011 (Figure 1).
Figure 1: Bayesian network connecting risk, mean temperature and weather pattern. Here "mean temp" means mean temperature. The stochastic significance of the network was established in the report. [9]
The results are shown in Figures 2 and 3, where the distribution of P (* | high risk) has been shown on the right hand side with title "winter", and the distribution of P (*) of mean temperature has been shown on the left hand side, titled " winter(high risk)" for the purpose of comparison. It is natural to expect the distribution P (* | high risk) will be similar to P (*) with high temperatures cut off, because the cold exposure is considered a main risk. Conversely, the results were different from what was expected. The graph of distribution, "winter (high risk)" in these figures showed that the distribution was divided into two groups the group of low temperature and the group of high temperature.
We examined more precisely some typical cases of each group, by exploring the change of mean temperature and the risk of disease. The group of high risk with low temperature simply meant the risk of cold exposure that was a well-known case for cerebral infarction. It was noticed that cold exposure caused the increase of patients of cerebral infarction with few days of lag.
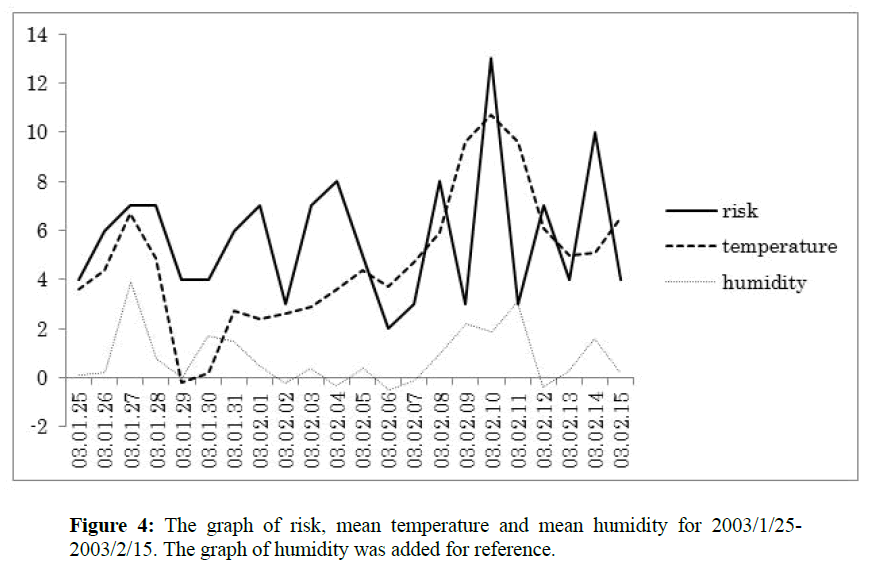
On the other hand, the group of high risk with high temperature seemed critical, because high temperature caused high risk, which contradicted common knowledge. Therefore, we examined more precisely these critical cases, by depicting again the change of mean temperature and the risk of disease. Figure 4 shows the case of February 10 in 2003. The number of patients scored 13, which was the highest number in 2003. There was a cold exposure on January 29 in 2003, and there was also a cold exposure on February 6. On these two days, a cold air covered Japan. The mean temperature increased from the 29th of January and showed an extreme increase after the 6th of February. It reached the highest temperature on the 10th of February, which was exactly the same day as the risk scored the maximum of 13. Thus cool and rewarming pattern was observed for this case.
To pursue the reason of this extraordinary case, we examined the change of weather patterns near the day of the 10th of February. The results were shown in Table 1. The days, 8th and 9th of February, were warm and humid with rain. The characteristics of high temperature and humidity were observed before the 10th of February, the highest risky day.
| 1/29 | 1/30 | 1/31 | 2/1 | 2/2 | 2/3 | 2/4 | 2/5 | 2/6 | 2/7 | 2/8 | 2/9 | 2/10 | |
| weather | W6 | W6 | W2 | W6 | W6 | W6 | W2 | W2 | W1 | W2 | W5 | W5 | W2 |
Table 1: The weather patterns during 2003/1/29 ~ 2003/2/10. The weather pattern W6 means a relatively humid pattern of low air pressure. The symbols W1 and W2 mean a relatively warm and cold pattern of high air pressure respectively, and the symbol W5 means a relatively warm pattern of low air pressure.
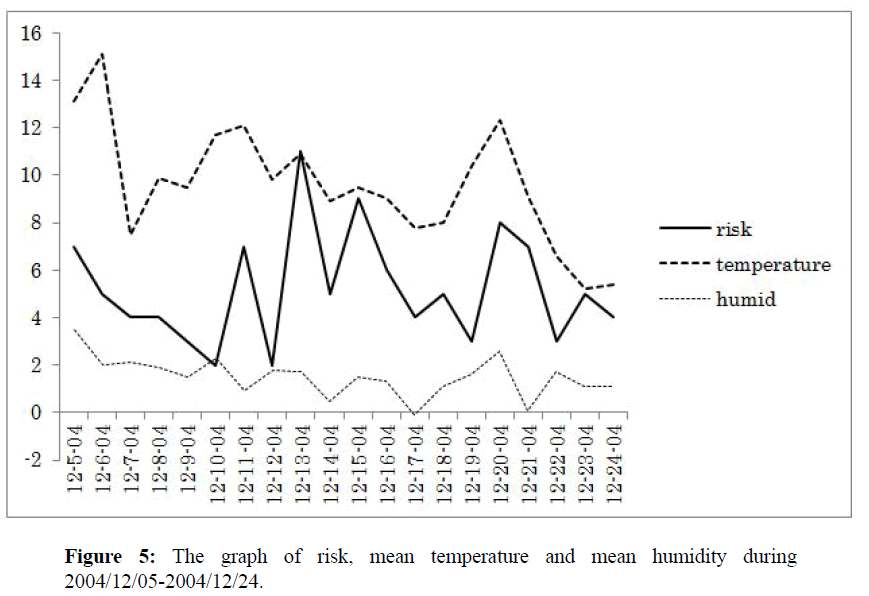
We pursued a similar way for the case of the 20th of February in 2004. In Figure 5, the cold exposure was observed on the 17th of February and the mean temperature increased until the 20th of February. The number of patients scored 8 on the same day. Cool and rewarming pattern was also observed on this case too.
To examine further this characteristic feature, we looked at the change of weather patterns near the day of the 20th of February in 2004, when the number of patients scored 8. The results have been shown in Table 2, where the weather pattern of the 19th of February was warm and humid. The characteristic of high temperature and humidity were observed.
| 12/17 | 12/18 | 12/19 | 12/20 | |
| weather state | 2 | 2 | 6 | 2 |
Table 2: The weather patterns during 2004/12/17 ~ 2004/12/20. The number of weather states is the same as those in Table 1. The number 6 indicates relatively warm and humid weather pattern. The number 2 means a type of cold high atmospheric pressure.
Cool and rewarming was the common feature among the groups of high risk with high temperature. We also found a low atmospheric pressure and humidity as a possible characteristic of the day of high temperature with high risk of disease. This suggests a mechanism, different from cold exposure, for high risk with high temperature, which has been discussed in the discussion section below.
Discussion
The present study identifies a "cool and rewarming pattern" associated with high-risk cases of cerebral infarction using Bayesian statistics. This is in contrast to a common knowledge that cold exposure itself is a risk factor to cerebral infarction. This pattern of rewarming cases was already pointed out4, using association analysis in connection with a change of atmospheric pressure. The existence of threshold that divided temperature into cold and warm cases was recognized [9] using Bayesian network. The results of the present paper provide a support and evidence for the results of these works.
The Bayesian analysis divided the high-risk cases into two groups, a cold group and a warm group. The first group is reasonable because coldness is normally associated with high risk of diseases. The second group is not reasonable and have been neglected as just an exception or noise in many regression models.
However, a close look at the second cases, hot and risky cases, revealed the existence of cold exposure before few days of the day of the second cases. Then, the trend of warming was following the cold exposure day and finally reached to a high risky day.
This trend of cool and rewarming process formed one of the typical patterns among days of high risk for cerebral infarction. This suggests that there is a different mechanism for the onset of cerebral infarction apart from simple cold exposure. Therefore, the investigation of gene expression becomes very important to search the links between DNA, the onset of diseases and the change of weather.
The changes of gene expression after cold exposure were observed in many studies. The reported work [6] found that cool and rewarming induced interleukin-8 (IL-8) expression. The IL-8 is a protein which is closely related to inflammation. Cold stress causes various inflammatory processes. The expression of IL-8 which is well known to be expressed in bronchial epithelial cell (BEC) and cause inflammation.
The reported work [10] studied the effect of hypothermia (4ºC, 1 hour) on the induction of heat shock proteins (HSP) in primary cultures of rat cardiomyocytes. After recovery at 37ºC for 2 hours, induction of HSP70, one of heat shock proteins (HSPs), was observed. They also examined the effect at 4, 10, 15, 20 or 25ºC with 4 h recovery at 37°C, and observed the induction of HSP70 under all conditions.
Several heat shock proteins play an important role in protein-protein interactions such as folding and assisting in the establishment of proper protein conformation (shape) and prevention of unwanted protein aggregation. Some members of the HSP family are expressed at low to moderate levels in all organisms because of their essential role in protein maintenance. Protein folding and unfolding provides thermo tolerance to cell on exposure to heat stress. This means that HSP play a role of chaperone.
The mRNAs of APG-1, a member of the HSP110 family, are induced by a temperature shift from 32 (moderate cool stress) to 39ºC in Mammalian Cells. [11] Here, cells are first exposed to the normal testicular temperature, 32ºC, for 20 hours and then incubated at 39ºC for 2 hours.
Therefore, the process of cool and rewarming can be observed in both the onset of cerebral infarction and the gene expression.
Humidity and atmospheric pressure also play an important role as risk factors of disease. In this paper, the changes of weather patterns were also observed in association with high risk of cerebral infarction. Before the incidence of cerebral infarction, the warm and humid pattern, W5 and W6 or the rain pattern W4 were observed in association with cool and warming procedure. The reported work [12] found that for C-reactive protein, CRP (a marker of inflammation), adding temperature, relative humidity, and air pressure resulted in higher AIC values among their regression models. Here again, we can observe that inflammation appears in connection with humidity. There were also statistically significant associations between heart rate variability and temperature and relative humidity. The reported work [3] found that rapid positive or negative changes in relative humidity and atmospheric pressure increased stroke risk.
A relation between humidity and DNA methylation was studied [13]. They suggested associations of ambient temperature and relative humidity with DNA methylation on LINE-1, Alu, and genes related to coagulation, inflammation, cortisol and metabolic pathway.
Thus, from these observations, we can notice that inflammation appears in connection with humidity and that humidity was associated with a cool and warming process observed in our study for high-risk cases of cerebral infarction. Besides this corresponds to the gene expression of IL-8 and DNA methylation which is closely related to inflammation. These results suggest that there is a close link between the change of weather, change of gene expression and incidence of cerebral infarction.
Conclusion
The present study identified cool and warming pattern in weather when the onset of cerebral infarction occurred using Bayesian analysis. We reveal in this study that the process of cool and warming play a key role for the links between weather, DNA and cerebral infarction. This finding may contribute to understand more clearly a mechanism that leads to the onset of cerebral infarction.
References
- Jimenez-Conde J., Ois A., Gomis M., CampelloR. Weather as a trigger of stroke. Cerebrovasc Dis 2008; 26: 348–354.
- McDonald RJ., McDonald JS., Bida JP., Kallmes DF., Cloft HJ. Subarachnoid hemorrhage incidence in the united states does not vary with season or temperature. Am J Neuroradiol 2012; 33: 1663-1668.
- Rakers F., Schiffner R., Rupprecht S. Rapid weather changes are associated with increased ischemic stroke risk: a case-crossover study. Eur J Epidemiol 2016; 31: 137–146.
- Morimoto H. Patterns in stroke occurrence on warm days in winter by associations analysis. Open Journal of Applied Sciences 2015; 5: 776-782.
- Sonna LA., Fujita J., Gaffin SL., Lilly CM. Molecular biology of thermoregulation invited review: Effects of heat and cold stress on mammalian gene expression. J Appl Physiol2002; 92: 1725–1742.
- Gon Y., Hashimoto S., Matsumoto K. Cooling and rewarming-induced IL-8 expression in human bronchial epithelial cells through p38 MAP kinase-dependent pathway. Biochem Biophys Res Commun 1998; 249: 156–160.
- Morimoto H. Hidden markov models and self-organizing maps applied to stroke incidence. O J App Sci 2016; 6: 158-168.
- Albert JH., Chi S. Bayesian analysis of binary and polychotomous response data. Journal of the American Statistical Association 1993;88: 669-679.
- Morimoto H. Exploring linkages between weather factors and the risk of cerebral infarction through the application of Bayesian networks, 2016, International Journal of Engineering and Applied Sciences 2016; 3: 14-17.
- Laios E., Rebeyka IM., Prody CA. Characterization of cold- induced heat shock protein expression in neonatal rat cardiomyocytes. Mol Cell Biochem1997; 173: 153-159.
- Fujita J. Cold shock response in mammalian cells. J MolMicrobiol Biotechnol1999; 1: 243-255.
- Ruckerl R., Ibald-Mulli A., KoenigW. Air pollution and markers of inflammation and coagulation in patients with coronary heart disease. American Journal of Respiratory and Critical Care Medicine 2006;173: 2006.
- Bind MA., ZanobettiA., GasparriniA. Effects of temperature and relative humidity on dna methylation. Epidemiology 2014; 25: 561–569.
Open Access Journals
- Aquaculture & Veterinary Science
- Chemistry & Chemical Sciences
- Clinical Sciences
- Engineering
- General Science
- Genetics & Molecular Biology
- Health Care & Nursing
- Immunology & Microbiology
- Materials Science
- Mathematics & Physics
- Medical Sciences
- Neurology & Psychiatry
- Oncology & Cancer Science
- Pharmaceutical Sciences
